Not All Customers Are Equal
You have customers who buy weekly, some monthly, and some who used to buy but have gone silent. If you treat them all the same, you are missing huge opportunities.
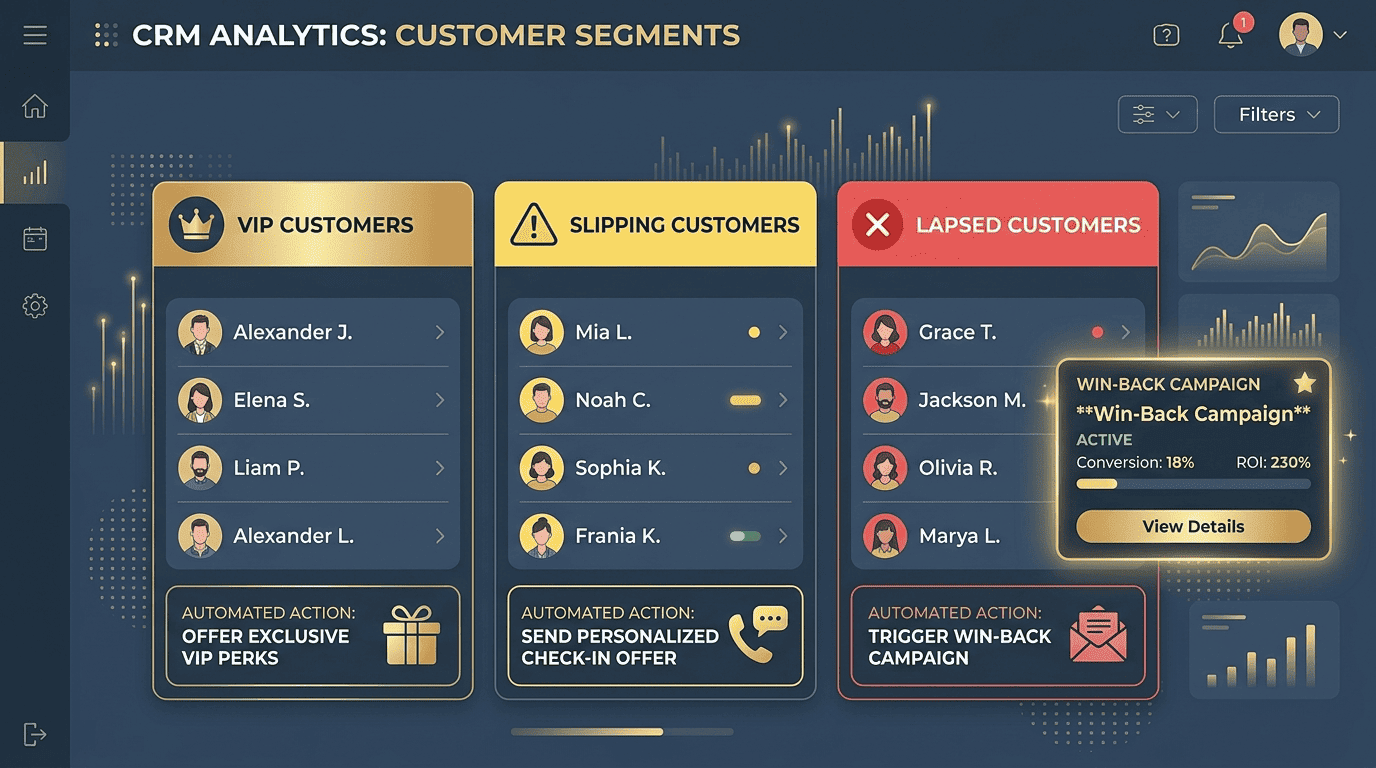
A Customer Frequency Report in your dashboard categorises customers by how often they buy, revealing your VIPs and your lapsed clients. Then you can stop guessing who deserves attention and start deciding it.
Two ways to treat the same list
Same customer list. Same products. The only difference is whether the business uses what it already knows.
One message for all
- VIPs get the same generic offer as strangers
- Lapsing customers fade without anyone noticing
- Lapsed customers are never contacted again
- Discounts are given to buyers who would have paid full price
- Retention depends on luck
A different move for each
- VIPs are recognised and rewarded
- Lapsing customers are caught in time
- Lapsed customers get a specific win back
- Discounts go where they actually change behaviour
- Retention becomes a process
How to use the frequency report
Identify your VIPs: high frequency, high value
These are the customers who buy often and spend a lot. They deserve special treatment. A loyalty discount, a personal phone call, a birthday gift. The dashboard can flag them for you.
"VIP: Jane M. 12 purchases in the last 3 months, total KSh 85,000."Spot the slipping: decreasing frequency
A customer who used to buy monthly but has not bought in 45 days is slipping away. The dashboard flags this, so you can reach out with a personalised offer before the habit breaks.
"Hi Jane, we miss you. Here is 10 percent off your next order to welcome you back."Win back the lapsed: no purchase in 90 or more days
These customers may have found a competitor, moved, or simply forgotten you. A specific win back campaign can recover a significant portion. The dashboard provides the list; you provide the message.
A targeted offer to one segment outperforms a general broadcast to everyone.Reading the frequency bands
Four bands, four different actions
| Band | Last purchase | Status | Action |
|---|---|---|---|
| Active | Within 30 days | VIP | Recognise and reward |
| Cooling | 31 to 45 days | Slipping | Soft check in |
| At risk | 46 to 90 days | Slipping | Personal offer |
| Lapsed | 91 to 180 days | Lapsed | Win back campaign |
| Inactive | Over 180 days | Inactive | Call or remove |
The bands are a starting point. Adjust the day counts to match your actual buying cycle, since a weekly buyer and a quarterly buyer should not share the same threshold.
The automated win back play
Set the rules once, act on the alerts
The beauty of this is that it runs in the background. You do not have to manually track who is lapsing. The dashboard does it for you, and you just act on the alerts that arrive.
Why the list is your most valuable asset
Existing customer
They already know you, have bought before, and trust the product. The only obstacle is a reason to come back.
New customer
You must earn awareness, trust and the first order from scratch. Every step costs money before a single sale arrives.
A practical start this week
Five steps to get the list right first
- Confirm that every customer record links to a phone number or account
- Decide the day thresholds that match your actual buying cycle
- Pull a list of customers with no purchase in the last 45 days
- Count how many VIPs are currently slipping, since those are urgent
- Write one message per band before automating anything
What this actually changes
- You know exactly who your top spenders are, by name
- You catch customers drifting before they are gone
- Win back messages reach a specific list, not everyone
- Discounts stop being spent on customers who did not need them
- Retention becomes a scheduled process instead of a hope
The summary
Stop treating all customers the same. Segment, target and win.
Your customer list is your most valuable asset. Use the frequency report to nurture your VIPs and reclaim the lost ones, because the return on retention is far higher than the cost of acquisition.
Ready to see your customer segments?
Stonehenge Digital builds business management dashboards with frequency bands, VIP flags and automated win back rules tied to your own buying cycle.
Generate My Customer Frequency Report →Interested in Business Management System?
Let's build this for your business
Replace spreadsheets, paper records, and WhatsApp chaos with a custom system built for exactly how your business works.