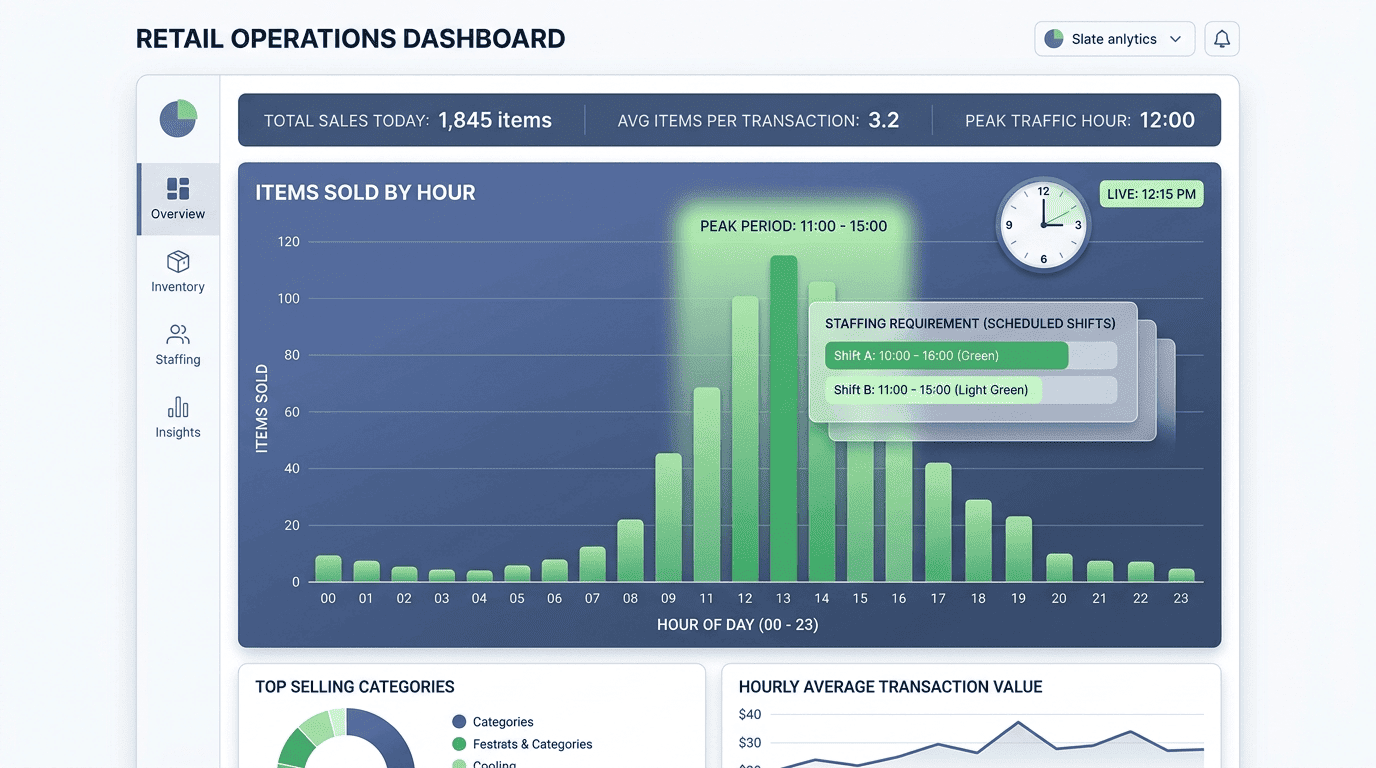
Beyond Daily Totals
Your dashboard shows you sold 150 items today. That is useful. But it does not tell you when those items sold. Were they all between 12 PM and 2 PM, or spread evenly?
Knowing the items sold per hour can transform how you staff your business and stock your shelves. A daily total tells you what happened. An hourly view tells you when, and when is what you can act on.
Two reports, two different decisions
The same 150 items appear in both columns. Only one of them tells you who to schedule for tomorrow.
One number, no timing
150 items sold today.
You know the volume, but not whether it arrived in a two hour rush or trickled in all day. Staffing and stocking decisions stay guesses.
One curve, clear actions
70% of sales between 11 AM and 3 PM.
You can schedule part time staff for the peak, reduce coverage in the quiet hours, and prepare stock before demand arrives.
The power of hourly data
Optimise staffing
If your dashboard shows that 70 percent of sales happen between 11 AM and 3 PM, that is when you need all hands on deck. Schedule part time staff to cover that peak and reduce staffing during slow hours. This cuts labour costs while ensuring you are fully staffed when it matters.
Same wage bill, better coverage. The saving comes from shifting hours, not cutting them.Optimise stocking
Certain products sell at certain times. Coffee sells in the morning, pastries in the afternoon. Your dashboard can show which items move at which hours, so you can prepare ahead of demand.
Bake more pastries before the afternoon rush, or ensure the morning coffee supply is fully stocked before opening.Plan promotions for slow hours
If you have a predictable slow hour, such as 3 PM to 5 PM, you can introduce a happy hour discount or a special offer during that window to smooth demand and increase total sales. The data tells you exactly when to run it.
A slow hour with a discount beats a slow hour with full price and empty seats.What the hourly pattern looks like
Reading the curve, hour by hour
| Hour | Share of sales | Pattern | Action |
|---|---|---|---|
| 9 AM | 6% | Slow | Prep and restock |
| 10 AM | 12% | Building | Coffee stock ready |
| 11 AM | 18% | Building | All staff on floor |
| 12 PM | 24% | Peak | Full coverage |
| 1 PM | 26% | Peak | Full coverage |
| 3 PM | 8% | Slow | Run a promotion |
| 5 PM | 6% | Slow | Reduce staffing |
Notice how the table produces decisions, not just numbers. Every row suggests something specific you could change about tomorrow.
The shape of your trading day
Most shops follow the same curve
The quiet start is for preparation, not for extra staff. The building phase is when stock must already be ready. The peak is where every hand matters. The fade is where a promotion can recover revenue you would otherwise lose to an empty shop.
How to implement hourly tracking
Confirm your point of sale timestamps every sale
Most modern POS systems record the exact time of every transaction automatically. Confirm that yours does, and that the time is correct, since a misconfigured clock quietly ruins every hourly report after it.
Check one transaction against the real time it happened. If the clock is wrong, fix it before analysing anything.Generate an items sold by hour report
Your dashboard should be able to produce this as a standard report, not a custom request. If it takes effort to produce, it will not be reviewed consistently.
The report should show quantity sold, revenue and the share of the daily total for each hour.Review it weekly and look for patterns
A single day is noise. Three or four weeks of hourly data shows a pattern you can plan around. Look for the hours that consistently carry the most and least revenue, then adjust operations accordingly.
Compare the same weekday to itself. Monday and Saturday rarely share the same curve.Putting the slow hours to work
What to do with a predictable quiet window
A slow hour is not a failure. It is a known, repeatable window where you have spare capacity and an audience that is not being served. That is exactly the shape of a good promotion opportunity.
Because the data tells you when it happens, you can design the offer around that specific window rather than discounting all day and giving away margin on sales you would have made anyway.
"3 PM to 5 PM only: 20 percent off all pastries."The goal is not to fill every quiet hour. It is to stop giving away full price discounting across the whole day just to rescue two slow hours.
A practical start this week
Five steps you can run today
- Confirm your point of sale timestamps each sale, and that the clock is accurate
- Pull the last four weeks of hourly sales for one typical weekday
- Mark the three highest revenue hours and the three lowest
- Compare your staff roster against those six hours honestly
- Change one thing, either a shift or a promotion, and measure the next four weeks
What this actually changes
- Staff shifts matched to real demand instead of habit
- Stock prepared before the rush instead of during it
- Fewer stock outs on high turnover items at peak
- Less waste on perishables prepared for the wrong hour
- Promotions placed where they recover revenue rather than erode it
The summary
Stop managing with daily averages. Drill down to the hour and unlock a new level of operational efficiency.
The daily total tells you what happened. The hourly curve tells you what to change tomorrow, and that is the number that actually moves the business.
Ready to see your sales by the hour?
Stonehenge Digital builds business management dashboards with timestamped transactions, hourly sales reports and demand patterns you can plan staffing and stock around.
Track My Hourly Sales →Interested in Business Management System?
Let's build this for your business
Replace spreadsheets, paper records, and WhatsApp chaos with a custom system built for exactly how your business works.